See Everything.
Miss Nothing.
One platform. Every operational signal.
Public ferry operations generate a continuous stream of data — every departure logged against a schedule, every maintenance task opened and closed, every safety event recorded, every report filed or missed. The Ferry Command Center connects all of it into a single real-time environment accessible to both operator and agency simultaneously.
When both parties see identical data at the same moment, trust compounds and intervention becomes possible before consequences arrive.
Built from live operational data


Your operation. Your contract structure. Your data.
Operators
Manage KPIs, maintenance, safety, crew, and compliance from a single dashboard. Every threshold tracked live, every alert tied to a contract reference. Your team knows exactly where they stand before the reporting period closes.
Transit Agencies
Full operational visibility without requesting a single report. Review the same real-time data your operator sees — performance trends, safety records, vessel status, and compliance triggers — on your own terms.
Municipalities
Verify that the public waterway investment is delivering results. Ridership trends, on-time performance, budget variance, and customer satisfaction — presented clearly, updated continuously, accessible to stakeholders who need answers.


Know the state of your system before anyone has to ask
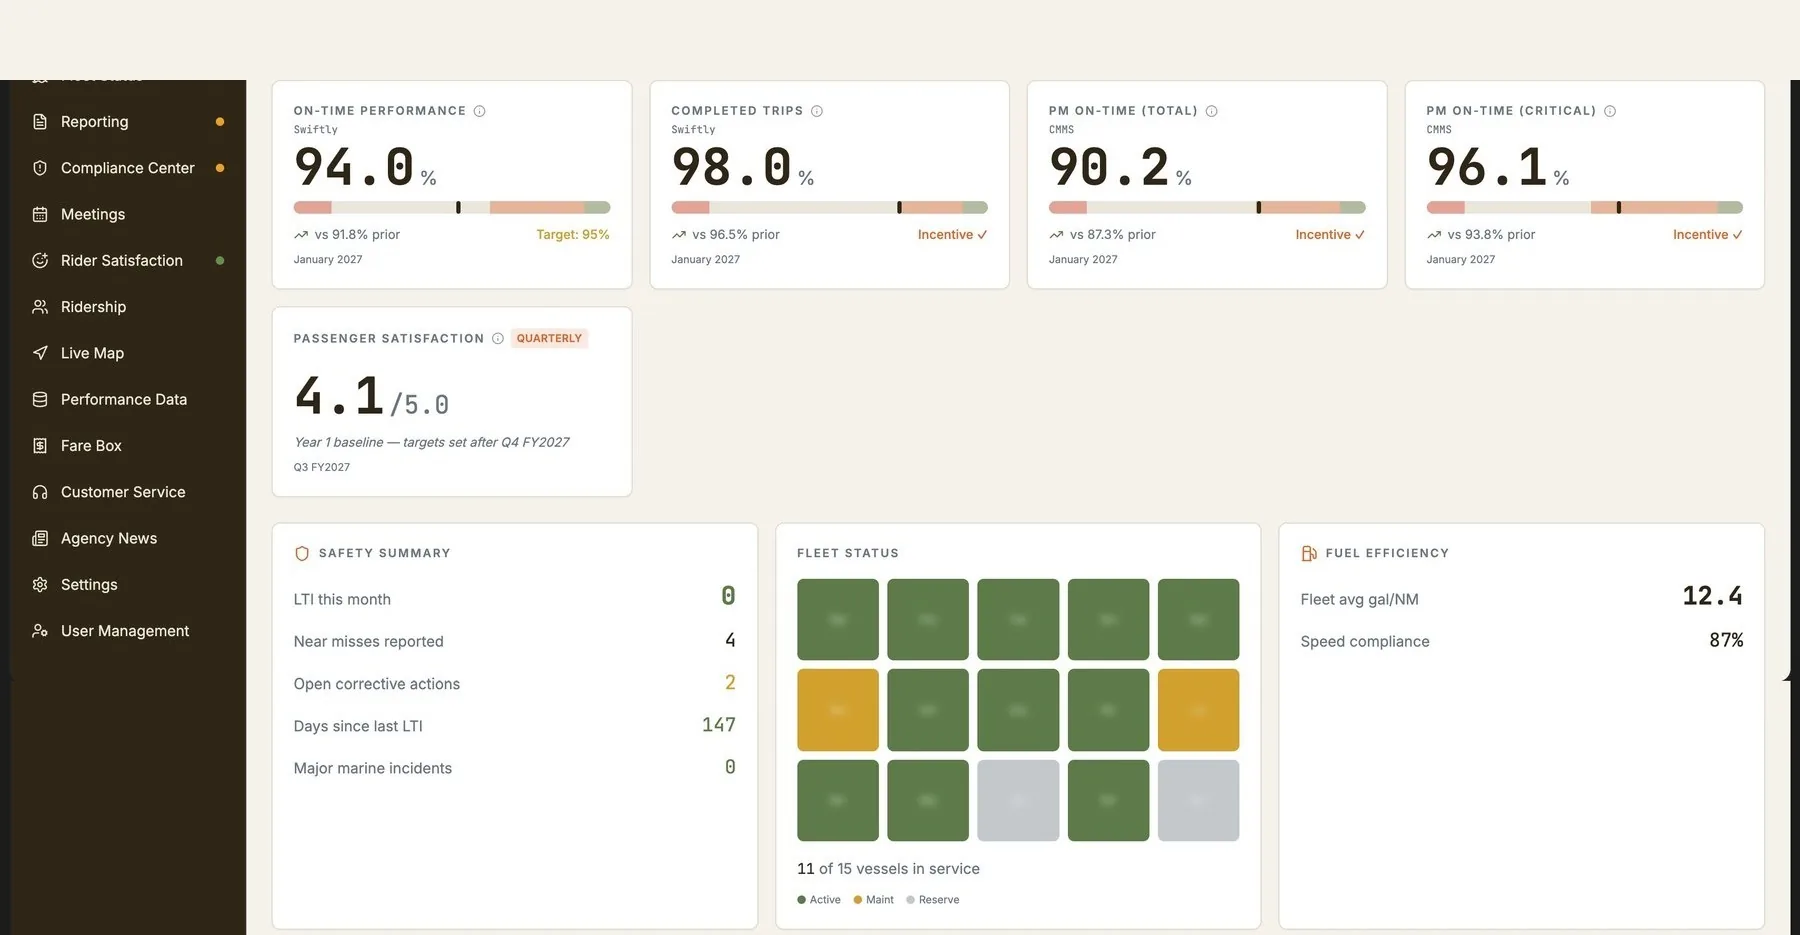
Operations Overview
KPI tiles with threshold tiers, fleet grid by status, AI-generated executive summaries, 12-month performance trends, and an alerts queue — every item tied to its contract reference. A director reading this at 7 AM has the full system state without opening a single report.
KPI Performance
On-time performance computed from GTFS-RT source data against your contract's exact formula. Route-level breakdowns, trend charts, monthly tables, and threshold status — both parties auditing the same numbers from the same source.
Live Map & Performance Data
Real-time vessel positions on a Mapbox-powered map with route detail panels and stop-level timing. Trip-level records with scheduled vs. actual arrivals, weather data, and boarding counts — the audit layer behind every KPI figure.
Ridership & Demand Forecast
Historical boardings by route, stop, and trip with a 30-day demand forecast built from load factors, event calendars, and NOAA weather signals. Right-size vessel assignments before the sailing, not after.
Fare Box & Revenue
Gross revenue, recognized revenue, deferred fare income, and scan rates — by route, trip, and stop. Revenue recognition by corridor shows where pricing products and rider behavior intersect.
Rider Satisfaction & NPS
Net Promoter Score, CSAT, response volume, and route-level breakdowns. Top positive and complaint themes alongside verbatim comments — dated, attributed, and cross-referenced with performance data.
The Ferry Command Center replaces the patchwork of weekly status emails, monthly PDFs, and disconnected CMMS logs with a single system of record — always current, always accessible, always connected to the contract provisions that define what matters most.
Every obligation tracked. Every threshold visible.
Safety Management
LTIR, near miss rates, corrective actions, drill compliance, and CG-2692 filing status — all on one screen. A four-step occurrence wizard captures incident details, pulls live weather from NOAA, surfaces notification deadlines, and auto-detects filing requirements.
Compliance Center
Major and minor assessment triggers mapped to your contract's attachment structure, computed from live source data. Current exposure is visible at all times — your team knows whether a work order at 3 of 4 is approaching the threshold before it becomes an assessment event.
Reporting
Every deliverable tracked from due date through submission, with status, feedback, and late-count annotations. Upcoming deadlines surface days in advance. A fiscal year late submittal tracker shows exactly how far your operation is from assessment thresholds.
Maintenance (CMMS)
Live CMMS integration for work order tracking and PM compliance. Budget variance, overdue counts, 24-hour submission compliance, and upcoming major maintenance — every metric tied to the contractual threshold that makes it financially material.
Fleet Status & Certifications
Every vessel's COI, COD, classification, ISM/SMS, and insurance expiry dates displayed with days-remaining countdowns. Shift log grids show which masters have documented departures today. Running hours feed maintenance planning models.
Weather & Risk Analysis
Live NOAA buoy data — wind, wave height, visibility, barometric pressure — with a 7-day forecast and risk tiers. Historical weather-to-OTP correlation tables enable calibrated dispatch decisions by route and condition band.
Meetings, customers, fuel, and the full operational picture
Meetings & Minutes
Structured meeting records with title, attendees, topics, and minutes — searchable and distributable with one click. When a board member asks what was discussed in last month's capital planning session, the answer is available in seconds.
Fuel & Energy
Fleet efficiency by vessel, monthly consumption, speed compliance, and estimated emissions. Shoreside tank status replaces phone calls to the dock. Route assignments that put legacy vessels on high-frequency corridors become visible decisions, not hidden costs.
Customer Service
CRM-integrated ticket health, agent productivity, SLA compliance, and stale ticket tracking. A spike in cancellation complaints on Tuesday morning tells the operations team that Monday's disruption wasn't communicated well — and the next event needs a different protocol.
Agency News
Real press releases and board decisions surfaced inside the same environment where the operations team manages service delivery. The connection between what the board approved and what the data shows becomes legible without a separate briefing.
User Management
Five-role access control enforced at the database level. Agency oversight staff get read-only visibility configured before service start. Agency isolation ensures multi-operator instances keep data completely separated — enforced by the database, not the application.
AI Executive Summaries
Every module generates a plain-language executive summary from live data — flagging trends, highlighting thresholds, and surfacing the operational narrative that numbers alone don't tell. Updated continuously, never stale.
Your contract. Your KPIs. Your thresholds.
The Ferry Command Center doesn't impose a one-size-fits-all framework. It maps to the contract structure, performance tiers, and compliance requirements that already govern your operation.
Contract-native architecture
Every alert, threshold, and assessment trigger is configured from your actual contract language — scope sections, attachment references, and tier definitions. The platform speaks the same vocabulary as your operating agreement.
Multi-operator, multi-agency
Run multiple operations on a single platform instance with complete data isolation between agencies. Each operator sees only their data. Each agency sees only their operator. Enforced at the database level, not just the UI.
Integration-ready from day one
Purpose-built connections to CMMS (maintenance), GTFS/GTFS-RT (vessel tracking), NOAA (weather), and CRM (customer service). Additional integrations configured to match your operational stack.
Operator-built, agency-validated
The Ferry Command Center was designed by the same team that runs ferry operations daily — not by a software vendor guessing at requirements. Every module exists because an operator needed it or an agency asked for it. That's why it works the first time it's opened.
Connected to the systems your operation already runs
The Ferry Command Center pulls live data from your existing operational tools — no manual uploads, no end-of-month reconciliation.
Enterprise-grade security, built for public agencies
Ready to see the platform in action?
We'll walk you through a live demonstration using real operational data. Every screenshot in our documentation comes from a running system.
Request a Demo